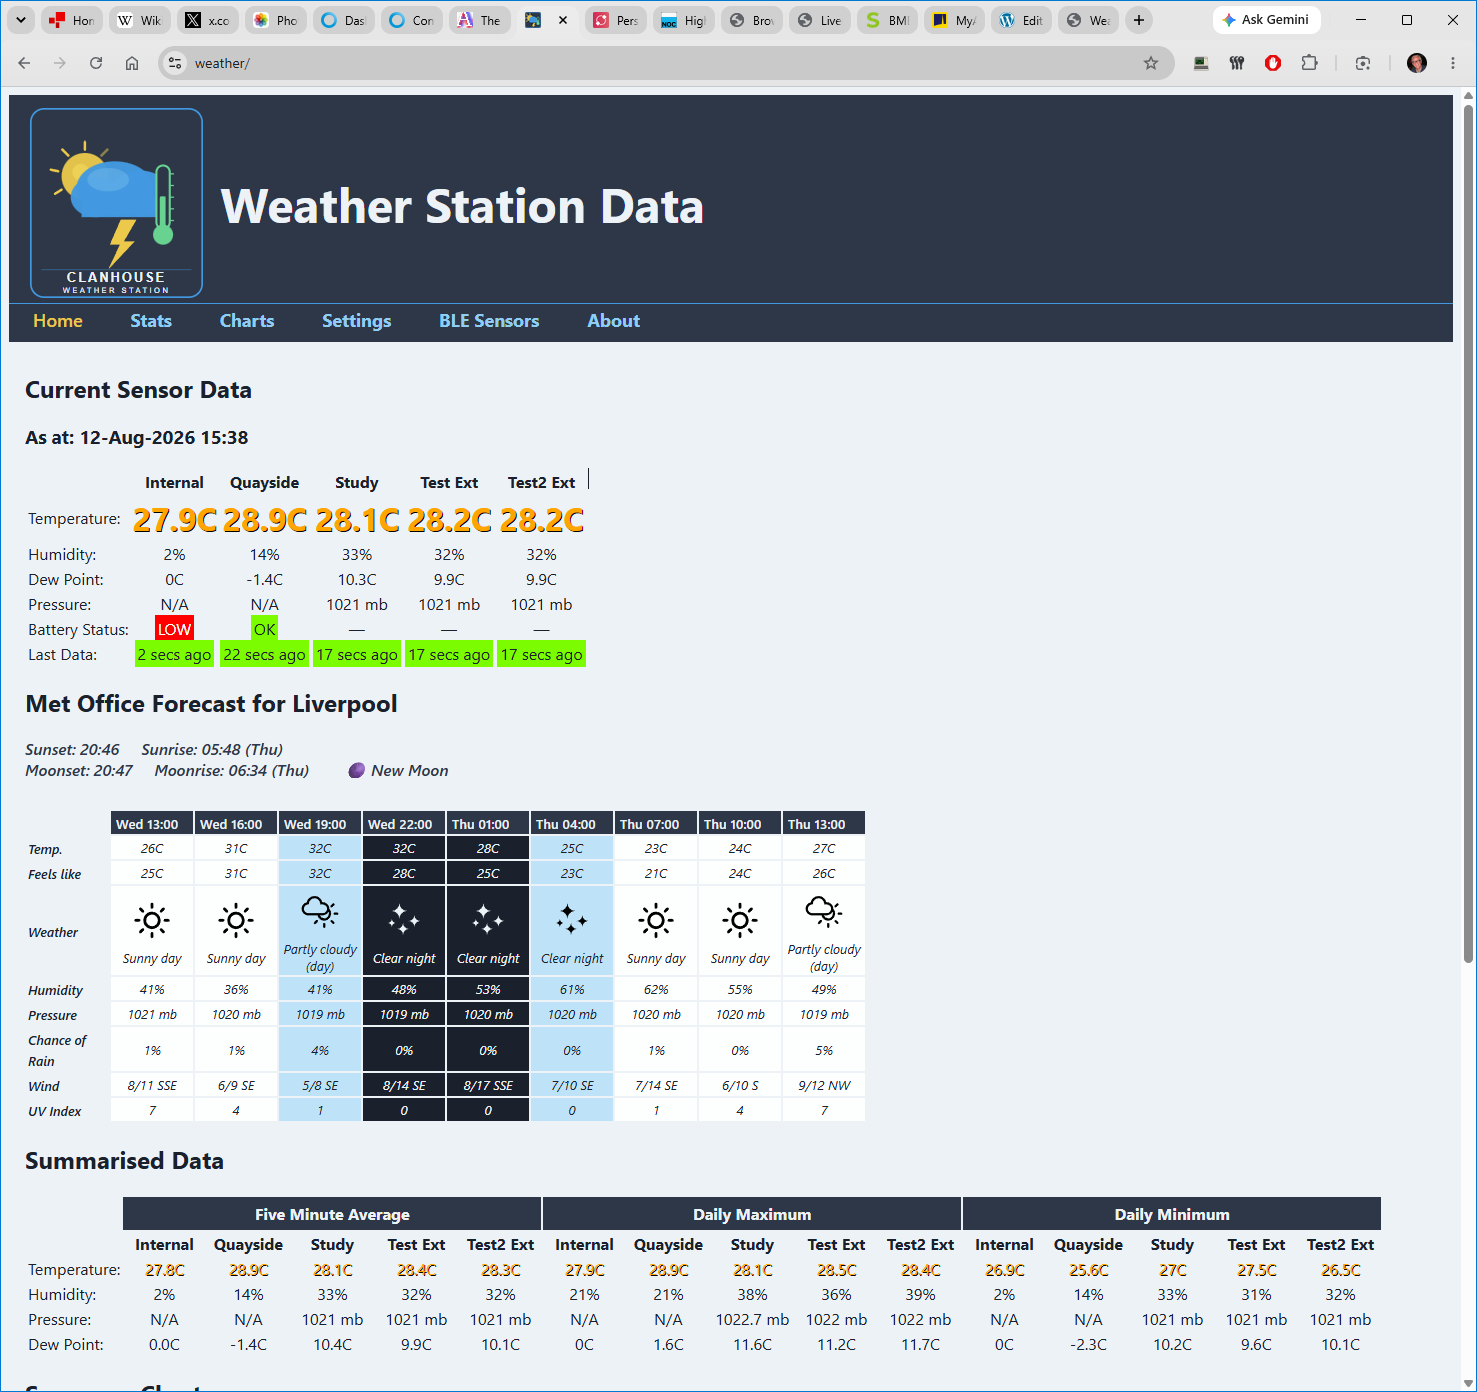
(With a little help from Claude!)
Ancient Technology
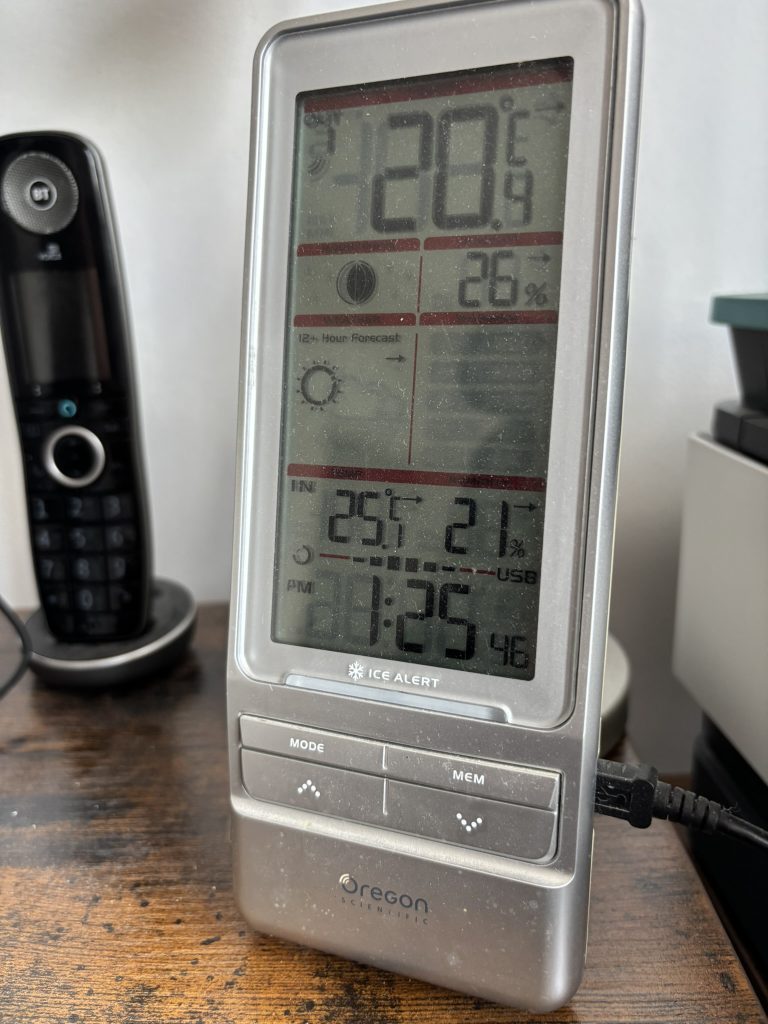
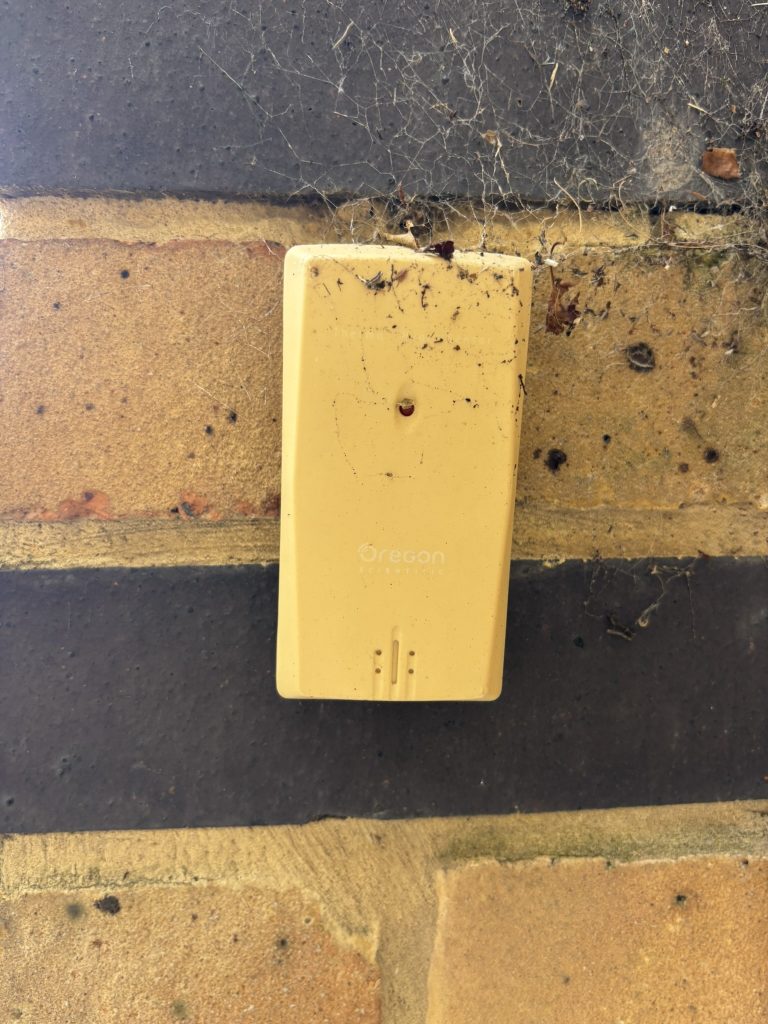
About 20 years ago, my wife bought me an Oregon Scientific RMS600 weather station as a Christmas present. It sat on a window ledge by my desk at home, with an external sensor in the garden. It was largely used to answer the question, “Will I need a coat today or not” before we began our daily school run and commute to work. It’s still in use today, though it sits on a different desk in a different city, and the plastic is yellowed with age.
I wanted this model because it has a USB interface for connection to a PC. I found some software, called WxDataLogger if I remember correctly, which could read the USB feed, log it and produce some nice graphs in a desktop app. In about 2010, this software stopped working. I think it was the arrival of a new PC with Windows 8 that killed it off. I learned to live without the pretty graphs and data logging for a long while.
The good thing about this weather station is that it has very low power consumption. The external sensor would go for 18 months on a single AA battery. The desktop unit would last a similar time, long enough in fact for battery leakage to be a problem. I’ve had to scrape gunk out of the battery compartment twice.
Now, however, the device is showing its age. It’s not just ageing of the plastic. The humidity readings from the sensors are dubious. The radio connection between sensor and base unit is temperamental. The atomic clock radio signal from Rugby is no longer broadcast regularly. It’s time to think about a replacement.
The Raspberry Pi solution
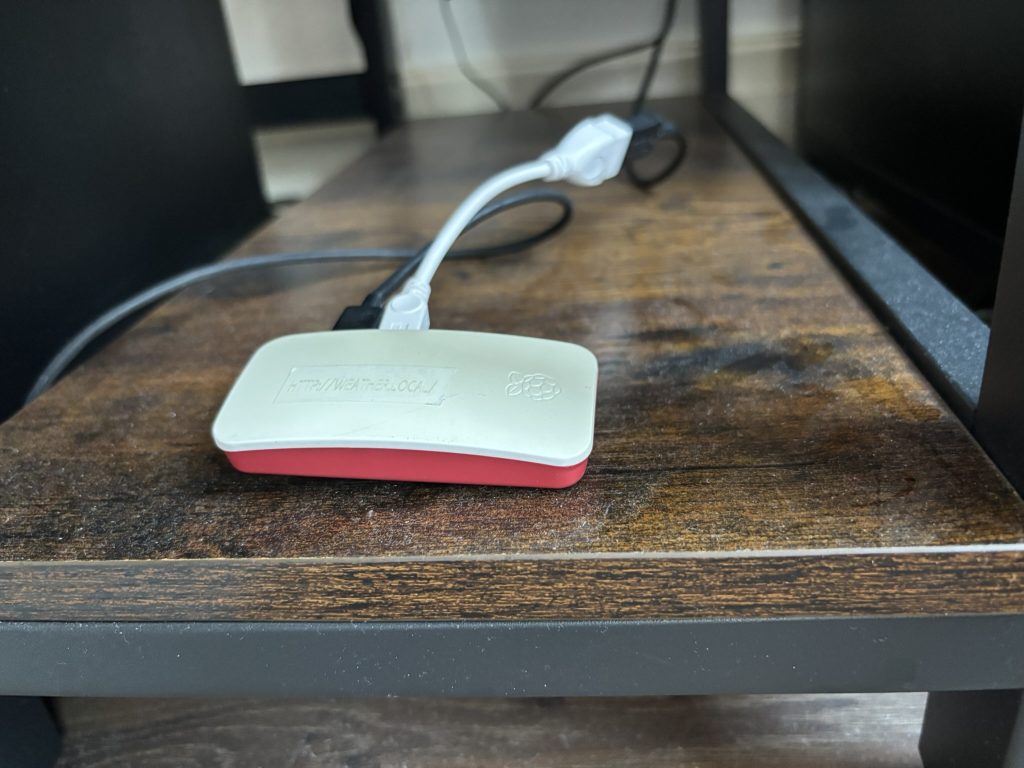
I’ve been a great fan of the Raspberry Pi since they first came out, and I currently have five of them. In 2019 I decided that a great hobby project would be to build a data logger of my own using a Raspberry Pi to collect data from the RMS600, log it, and display the output on a small website. I bought a Pi Zero W starter kit. Though I had a great many years of C development behind me, I chose to develop in Python. I used Flask and Jinja for the website and Flask’s built-in web server seemed adequate for a web site that should, in theory, have just three users. All code was lovingly hand crafted by myself. I also designed the website look & feel but, as I have basically zero artistic talent, this left a little to be desired!
In the UK, it is easy to get free access to weather data from the government’s Met Office provided you only want low volumes of data. With this, I was able to add a short local weather forecast to the main dashboard, plus local sunrise, sunset, moonrise and moonset calculated with astropy.
Of course, technology moves on. I had issues with the Flask web server which, in its defense, is really only meant for development and debugging use. I wanted to upgrade to Apache but the original Pi Zero W was underpowered for that. I decided to upgrade the processor as well as the web server, Replacing the Pi was easy. The Pi Zero 2W was a zero effort swap for the original Pi, needing no changes whatsoever to the software. I eventually upgraded the OS so that I could use RPI Connect but, on the whole, the set-up ran exactly like it always had,
Switching to Apache2 was definitely a learning experience, so I cheated and got an AI to do the configuration work for me. I remain firmly of the opinion that life is too short for understanding important software that requires uber-nerd levels of command line and config file knowledge.
The Revamp: Pi, Arduino and BLE
What finally forced me to change things? The readings from the RMS600, particularly the humidity readings, started to look wrong and way different to what the Met Office was predicting. As well as the aging hardware, the Met Office also made the data service that I was using obsolete and the replacement would need a lot of software changes, I was also looking for another hobby project to keep me out of trouble in my retirement. (The previous one had been to complete an MSc in Astrophysics.)
As the RMS600 has excellent battery life, I needed a replacement for it that would run for months on a single battery or battery charge. There are commercial weather sensors that will run for months on a single coin-sized battery and use Bluetooth Low Energy to send data. (If you’re unfamiliar with BLE, it’s also the technology behind the Apple AirTag.) I’d heard that Arduino was a great platform for IoT experimentation and I’d discovered the Seeed Xiao range of thumbnail-sized processors with built-in WiFi and Bluetooth. I opted to try the Xiao ESP32C6, which has all these features plus 4MB of flash memory and claimed to have an ultra-low power mode. Moreover, the Xiao chips are compatible with a whole range of boards and sensors, including weather sensors, using the Grove interconnection standard. This latter is a four wire connector with standard plugs for I2C, SPI and GPIO connection. This eliminated the need for soldering, a bonus as I am a terrible at soldering.
The Internal Device
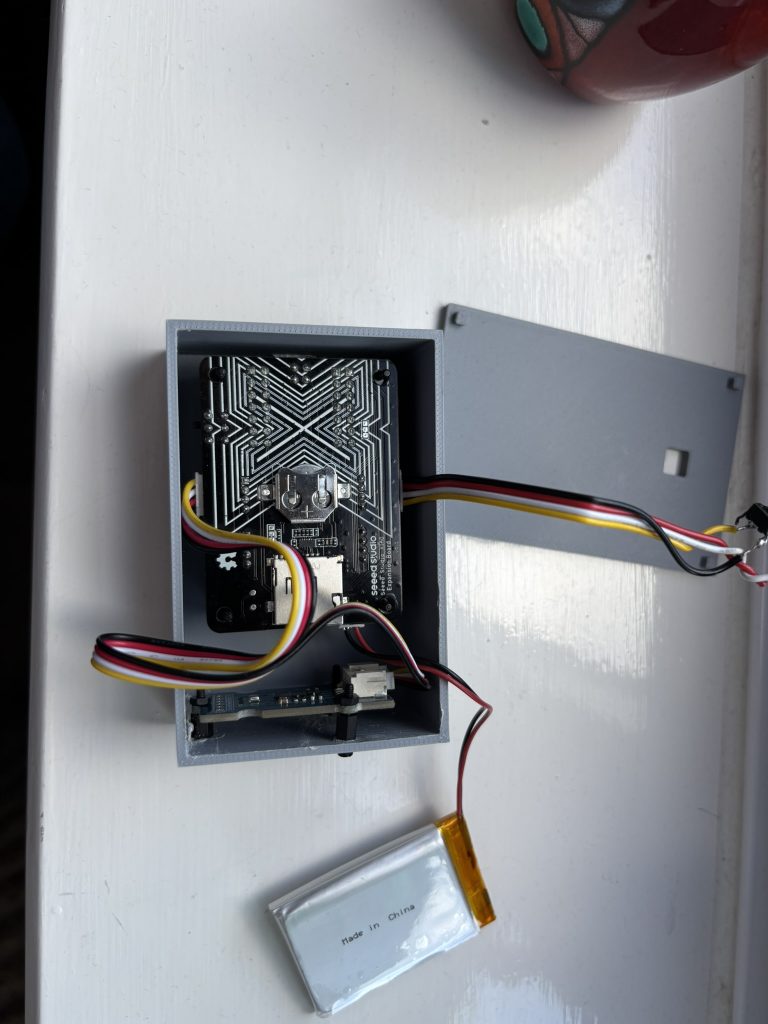
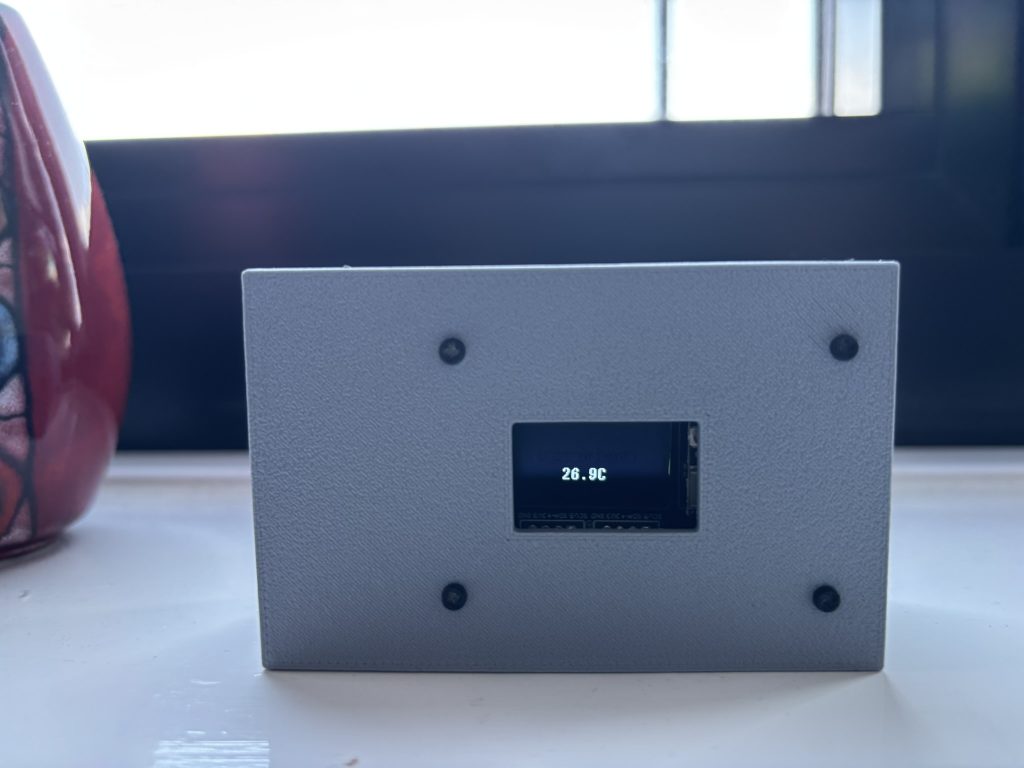
The first weather sensor that I designed was intended to replace the RMS600 base unit. It didn’t need to be a low power unit as I could run it on USB power from a desktop hub. It would also run for several hours from the built-in rechargeable battery.
Hardware wise, the device consists of:
- ESP32C6 Processor
- Grove Xiao expansion board with mono display, RTC and battery management
- Grove BME280 temperature, pressure and humidity sensor
- A simple button to turn on the display for a while
- A 1100mAh 3.7V Li-Po battery
- A Grove connector for the BME280
- A hacked Grove connector for the button
- A 3D-printed case
- Some screws and mounting posts
I was pleasantly surprised to discover how easy Arduino programming is, as it is just a cut-down version of C. It did not take long to write the software to read data from the BME 280 , write a configuration manager for WiFi setup and a couple of REST endpoints to serve the weather readings as JSON data. However, I primarily wanted the device to broadcast its data as a Bluetooth Low Energy beacon.
BLE is an interesting technology designed for situations where low power consumption is a must. A BLE beacon broadcasts just 32 bytes of useful data at a time. 16 bytes are a service ID and the other 16 bytes are specific data. If you have an Apple AirTag for example, it broadcasts the Apple iBeacon service ID and a 16-byte unique identifier for the tag. It is your iPhone – or someone else’s – that picks up this broadcast and informs Apple of the unique ID and the location where it was seen. Google have a similar beacon format called Eddystone. There are a couple of different types of Eddystone beacon and one of these, like the iBeacon, can transmit just a 16 byte unique ID. For simplicity, I devised a way to pack the data readings from my device into a 16-byte Eddystone UID packet. (This is a bit naughty. I should really use my own Service ID but debugging is easier if your app thinks it’s receiving Eddystone.)
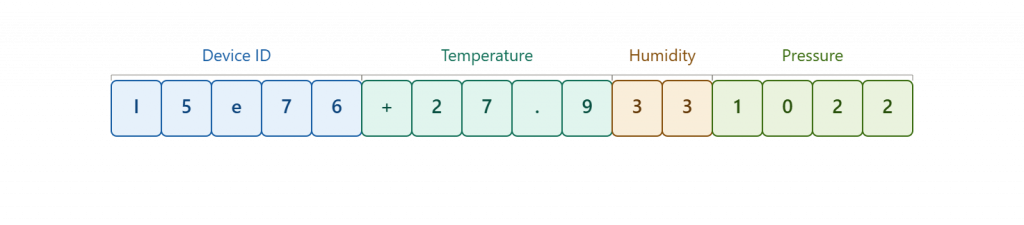
Programming with BLE on Arduino is not straightforward. There are multiple, incompatible software libraries available. If you are not careful (…guilty as charged!…) you can inadvertently mix up calls from different libraries and spend hours wondering why nothing works. The libraries have different approaches as to which other data in addition to the 32 useful bytes you need to explicitly supply. Do your research and stick to just one library.
You’ll need a good Bluetooth tool on your phone to help debug the broadcast packets. I used BT Inspector, Core Beacons and, later, nRF Connect.
The External Unit
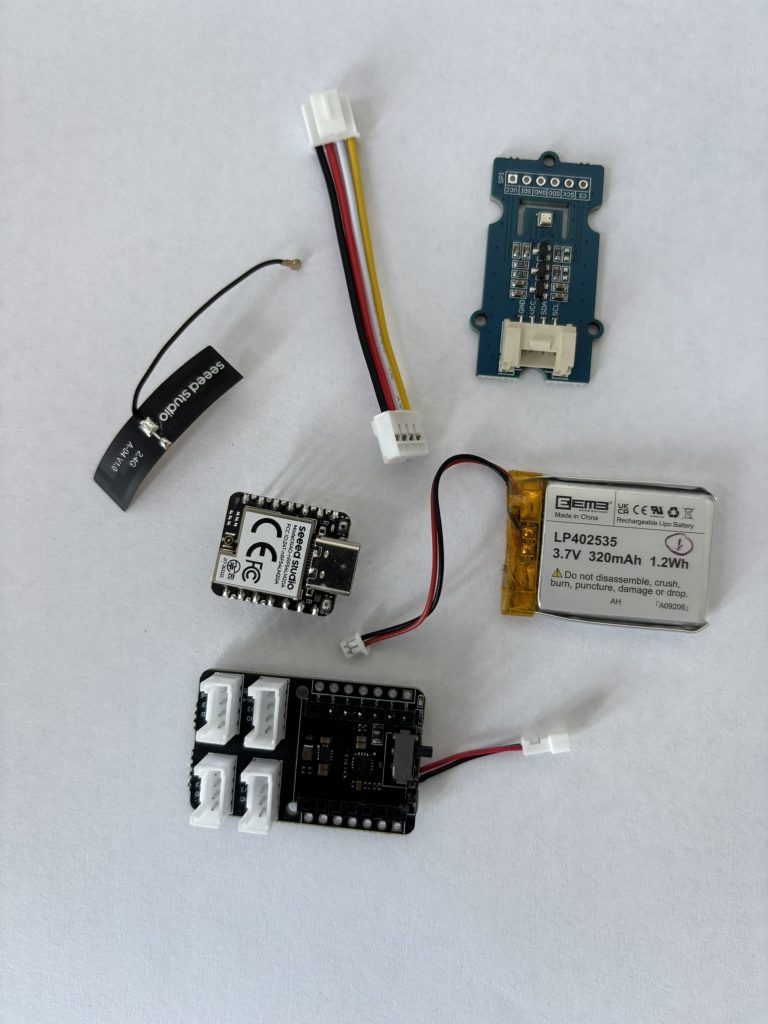
My real fun started with the external unit. This needed to be small, compact and definitely have low power consumption. My initial design was as follows:
- Xiao ESP32C6 (same as internal unit)
- Grove base (no screen!)
- Grove BME 280 temperature, pressure and humidity sensor
- Grove connector for the BME280
- A 330mAh 3.7V Li-Po battery
- A lead to connect the battery to the Grove base
The ESP32C6 claimed to have a deep sleep mode where it used only 13 μA. It ran the same beacon code as the internal device, Even with higher power consumption when awake for broadcasting, I estimated a battery life of about 100 days. I got about 90 hours. Something was consuming 25x the expected power.
My first suspicion was that the BME 280 was the culprit. I researched and found that it sometimes consumed power over its I2C interface even when supposedly in sleep mode. The solution was to power it from a GPIO pin from the ESP32 that could be explicitly turned off. However, I still got just a 90 hour battery life and the BME280 started giving strange readings to boot!
Now, one thing I really like about Seeed stuff is that the online support forums are amongst the best I’ve come across. They are helpful, relevant, informative and never condescending. I asked for advice there and immediately got a helpful response: the default Arduino libraries for the BME280 were problematic and I should try the Adafruit ones. This solved the problem of the strange readings, but battery life was still far too short.
I had to take a short break from my project while some building work was taking place at home, and when I returned I still could not get to the bottom of the power consumption problem. Something was still consuming around 3mA on average when I was expecting around 60μA on average, I again did some research and returned to the Seeed forums and had a “D’Oh” moment. I had misread a graph. The ESP32C6 is actually a beast when it comes to power consumption. It consumes many 10s of milliamps, even over 100mA, when it wakes up and starts broadcasting. With the wake/sleep and broadcast intervals that I had set, the 3mA average power consumption was explained perfectly. The ESP32 wasn’t fir for purpose and I had to rethink the processor chip.
On advice from the forums, I invested in a couple of chips that were known to have very low power consumption: the Nordic Semiconductors nRF54LM20A (Phew, what a mouthful!). These came in the same pin packaging as the ESP32C6 so simply replaced the old processor. I called upon the help of AI (Claude Sonnet) to refactor the software for the new chip and had everything up and running in an afternoon. Even with the wake/sleep/broadcast cycle timings set to values that I needed for debugging, I immediately got 170 hours of battery life on a single charge and knew I had plenty of scope to extend this by a factor of 10 or more.
One thing that I did notice was that the transmission power of the the nRF54 was quite low. It could be altered in software my a certain amount, but not enough to make the data readable beyond a short distance. The key learning point here was this: DON’T THROW AWAY THE PACKAGING! It turns out that there is a small external antenna wire wrapped around the side of the foam packaging that the chip comes in. When attached, this boosted the RSSI magnificently and I was back in business.
Updating the Website
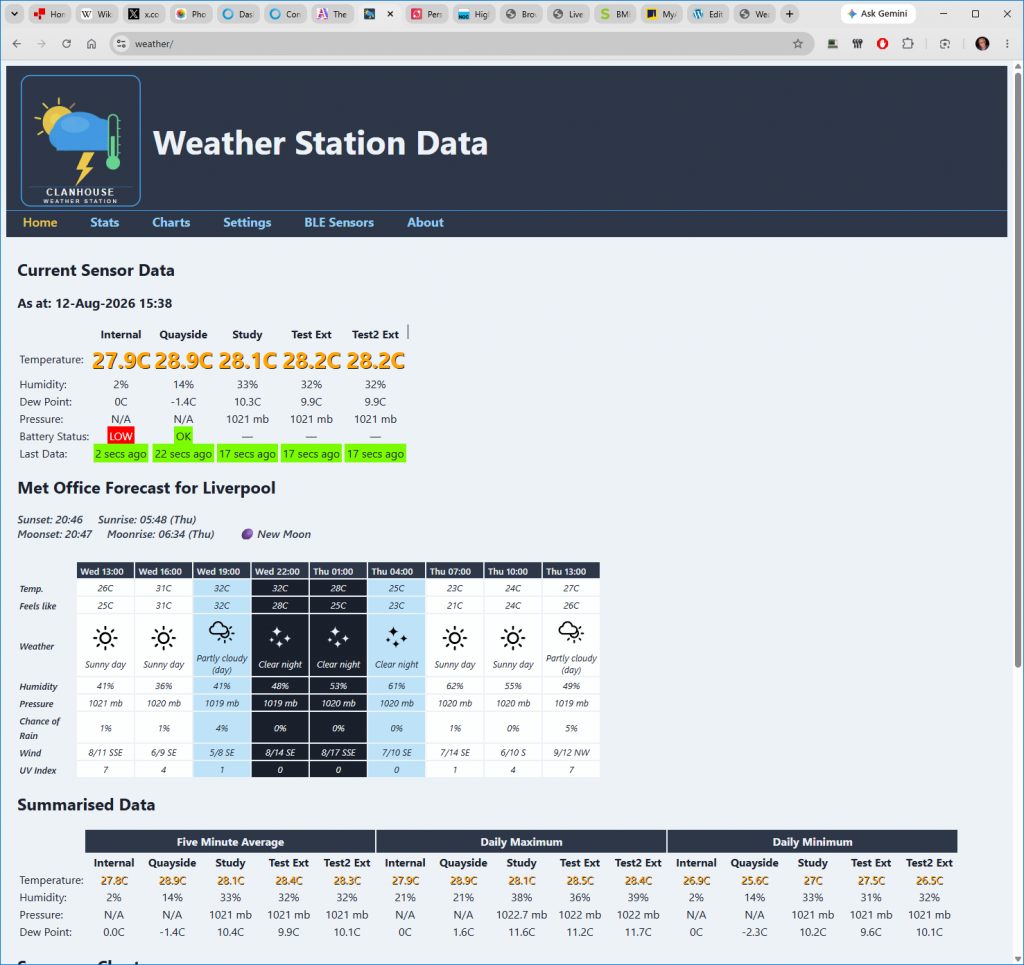
The old website was not visually appealing because, as I said, my artistic skills are pretty non-existent. I again asked Claude for some suggestions and got a style that I though was pretty decent.

As I quite often access the site from my iPhone and iPad, I also took the opportunity to add a hamburger menu
The cosmetic changes were trivial, but I now needed the website to find and read data from the BLE devices. This required some big structural changes. On the old site, reading the USB just ran as a separate thread which fed data to the web application. I decided to split the application into two: a backend to gather data from various devices, USB or BLE, and a front end purely to drive the website. With the aid of Claude, I had this division of labour working in a couple of days, about 50% of which effort was figuring out the correct Apache configurations. (see previous grumble.)
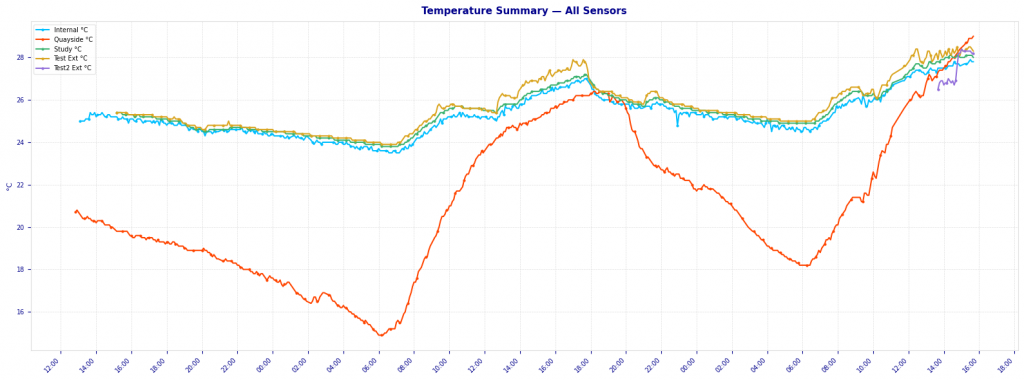
I’d already written some python scripts to find and read my weather devices while I was perfecting the Eddystone payload format. I threw this at Clause and got the AI to create a beacon detection page. This scans for beacons sending the right payload format and adds them to the backend. The backend was now handling two sets of devices, an untouched legacy USB set and an number of BLE beacons. Data from each group is collected by a separate thread and then all is logged into CSV files in similar formats. I also switched production of the graphs from an inefficient SVG library to PNGs generated by matplotlib every 5 minutes. This was much quicker to generate too,
With the data capture complete only the front end changes remained. These changes were fairly trivial. I kept the USB devices as they were and just added the new BLE devices in after them. Matplotlib took care of the graphing. All-in-all, the front end changes took an afternoon.
Calibrating the Sensors
I naively assumed that three BME280-based devices would give readings consistent within the advertised accuracy ranges of the device, which was about 0.5C for temperature readings. This turned out to far from the case. I had three devices sitting within centimetres of each other on my desk. The RMS600 and the internal BLE device gave very consistent readings for temperature but the external BLE device was almost 2C different in its reading. I could see from my graphs that this difference stayed constant. Now the internal device is powered by a 5V USB supply and is based on the ESP32C6 chip whereas the external device was in effect a 3.3V device with an nRF54-based chip. This difference in supply voltage or chip was, I suspect, causing the discrepancy.
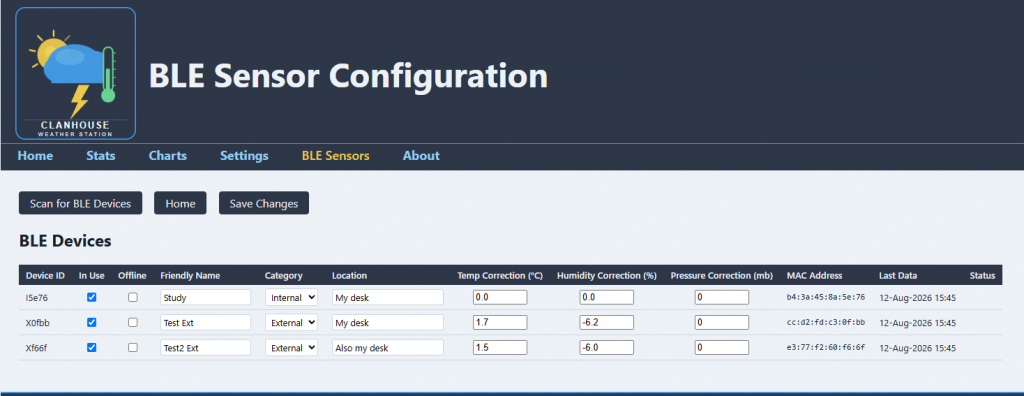
To solve the problem, I added correction fields to the BLE device configuration pages. With these I could compensate for systematic variation between devices. Since all the devices logged data to CSV files it was a simple job – for Claude again – to check what corrections were needed . Interestingly, when I built a second external device, it needed almost exactly the same correction values as the first which seem to confirm my theory.
Paranoia: Security
If you’re going to expose a device to the internet, it’s absolutely necessary to make sure that it can’t be hacked and doesn’t give some low-lives a way into your home network. What better way to address this than by – you’ve guessed it! – getting an AI to help.
I took a two pronged approach. Claude already had access to all my source code and details of my home network so I asked for a security design review and static test. Next, I fired up Openclaw on a sandboxed VM and got it to do some non-destructive tests. Between the two approaches I got about 10 potential weaknesses. None were serious but I fixed all but the most innocuous. Hopefully, the Pi is now hack-proof. (Famous last words? Maybe, but I also have a daily script that checks for intruders on the home network.)
Documentation? Yes, you heard me right!
One of my pet hates is inadequate documentation for a system. There is no such thing as self documenting code. Nevertheless, it is a thankless task. And who better to take on a thankless task than…Claude! I got the AI to document the whole set-up, including how to set up the web site on a brand new Raspberry Pi.
What remains to be done?
It is my intention to eventually post my code and documentation on GitHub but I need a break so that may not happen for a while.
Also, you’ve probably noticed that I don’t have cases yet for the external units. I designed one for the internal unit using TinkerCad and had my son print it off for me, but he lives some way off now. I plan to get my own 3D printer soon and have already designed the cases for the external devices on TinkerCad
..and finally
I guess you’ll now want to know where to find this amazing weather station. You’ll find it here: https://weather.clanhouse.com
(If that doesn’t work, I’ll keep the old link at clanhouse.hopto.org live for a few more weeks.)
Leave a Reply
You must be logged in to post a comment.